Aleš Hradil

1. Russell 2000 vs S&P SmallCap 600: the gap in balance-sheet quality
When looking at US small caps, it is essential to distinguish between the two main benchmarks:
- Russell 2000: It consists of a mechanical selection of 2,000 companies with no profitability screen. It is pure, rigid mathematics with no human element.
- S&P SmallCap 600: It is compiled by an S&P selection committee that applies a strict profitability screen. It is precisely this element of human discretion that prevents speculators from calculating the committee's decisions in advance.
35–40% loss-making companies in the index
Today, the Russell 2000 holds hundreds of so-called “zombie companies” whose operating profit cannot even cover their interest costs. Moreover, 30 to 45% of their debt carries a floating interest rate, which crushes them in an environment of higher interest rates. Thanks to the quality screen applied at inclusion, the S&P 600 contains significantly less of this dead weight.
2. The arbitrage mechanism: how Wall Street front-runs passive capital
The predictable reconstitution of the Russell index creates an ideal environment for systematic arbitrage by large institutional players:
- Exact calculation in advance: The Russell rules are public. The May snapshot gives the market precise data, and the window until the June rebalance leaves room to calculate mathematically which companies will be added.
- Dominance of big capital: This is not about small speculators, but about large active players and quantitative funds. They have the capital to buy up the targeted stocks in advance and, if necessary, to deliberately “push” the market capitalisation of specific companies into the index through targeted purchases.
- Exit liquidity at the expense of passive investors: At the rebalance itself, passive ETFs must take over these stocks at inflated prices. The big players take their profits, while passive capital absorbs the overpriced stocks.
With the move to semi-annual rebalancing, this window for arbitrage at the expense of passive investors now opens twice as often.
3. Results in practice (2019–2026): where does excess return arise and where does it disappear?
Data from the Allocation Calculator over a period of 7.7 years reveal the key mechanism behind fees and real returns:
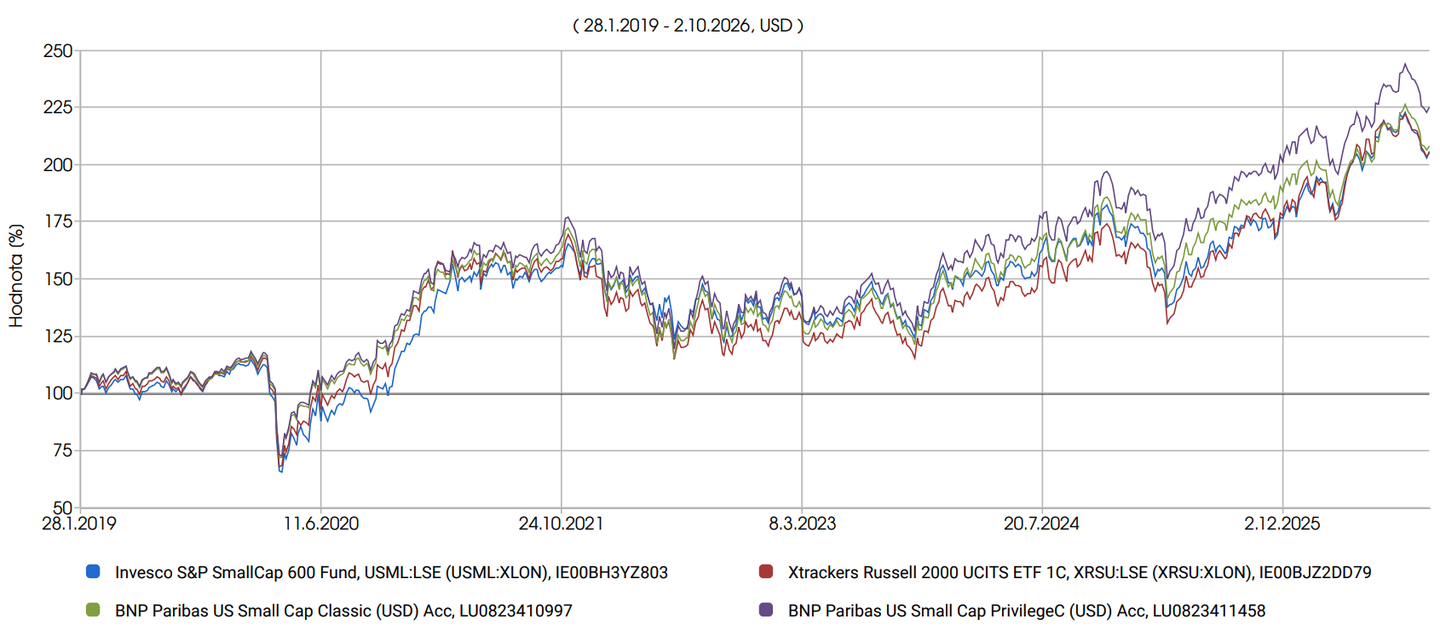
- Russell 2000 ETF (TER 0.30%) and S&P 600 ETF (TER 0.14%): Over the period under review, they delivered a return of ~9.8–9.9% p.a. Note, however, that for the client the additional costs of the adviser, administration and the intermediary platform must be added on top of this result.
- BNP US Small Cap Classic (TER 2.21%): It delivered a seemingly comparable return of ~10.0% p.a. The crucial difference, however, is that this figure is final for the client. The TER already fully covers the adviser who mentors the client as well as the platform that executes the transactions.
- BNP US Small Cap Privilege (TER 1.21%): The most logical route is to use the active strategy in its clean (commission-free) share class. Here, just as with ETFs, the advisory and platform fees are charged separately. The net results, however, speak clearly: the strategy delivers ~11.0% p.a., with a net lead of +1 pp per year over passive index ETFs.
Note: The accumulating ETFs represent the Net Return variant after reinvestment of dividends and withholding tax. The specific BNP fund is used in this analysis solely as a representative market example that is widely available to Czech investors. Finding high-quality active management in this segment (whether as a traditional fund or an active ETF) is not at all difficult, even though Czech investors do not have a particularly wide choice.
Why don't passive management and the clean share class of an active fund deliver the same result?
Swapping a high-quality active fund in a clean share class for a passive index ETF is not an equivalent step for the investor:
- Sustainable excess return without fortune-telling: In the small-cap segment, an active manager's alpha does not come from attempts to time the market, but from the consistent exclusion of visible risks. The managers of these funds work with the same data as the Wall Street speculators, but they play on the client's side: leaving out 30 to 40% of loss-making companies is a fundamentally defensible and sustainable long-term concept. And it is perfectly normal to be paid for it. In the end, the bill for this dinner is footed by the passive investor who wanted to save on fees at all costs.
- The low-TER alibi fails: Choosing an inefficient passive index solely on the basis of the fee leaflet means ignoring the real quality of the underlying companies and the rebalancing process.
Is blindly financing other people's speculation through passive indices really the best route we want to offer investors?
This article reflects the personal views of the author and is for information and analytical purposes only. It does not constitute an investment recommendation, investment advice or an offer to buy or sell financial instruments. Investing involves risks: the value of an investment can go down as well as up and the return of the amount invested is not guaranteed. Past performance is not a reliable indicator of future results. Before making an investment decision, consider your objectives and financial situation and seek professional advice where appropriate.